
Expected price range
Each range is set from the stock’s recent price history and our Hold rating, using its own 1-year realised volatility (85% annualised) as the width of a ~68% statistical band, and checked against that rating so the range leans the same way as our view. Starting price $89.38 (close 2026-10-30). The stock traded between $83.45 and $160 over the last 6 months and between $48.68 and $160 over the last year. This is an illustration of where our view and normal volatility point, not a forecast, price target or investment advice; the stock can move outside it.
| Company | Oct 25 | Nov 25 | Dec 25 | Jan 26 | Feb 26 | Mar 26 | Apr 26 | May 26 | Jun 26 | Jul 26 | Aug 26 | Sep 26 | 12-Mo |
|---|---|---|---|---|---|---|---|---|---|---|---|---|---|
| FORM | +51% | +0% | +1% | +26% | +40% | -2% | +40% | -8% | +28% | -34% | -5% | +48% | +310% |
| TER | +32% | +0% | +6% | +25% | +33% | -7% | +16% | +9% | +29% | -24% | -5% | +15% | +192% |
| AMAT | +14% | +8% | +2% | +25% | +16% | -8% | +15% | +14% | +61% | -30% | -10% | +12% | +151% |
| KLAC | +12% | -3% | +3% | +18% | +7% | -3% | +19% | +10% | +57% | -39% | -4% | +11% | +82% |
| LRCX | +18% | -1% | +10% | +36% | +0% | -9% | +21% | +23% | +36% | -32% | +3% | +9% | +146% |
| ACLS | -19% | +4% | -3% | +10% | -6% | +13% | +49% | +8% | +26% | -31% | -12% | +14% | +34% |
Source: Yahoo Finance monthly adjusted close.
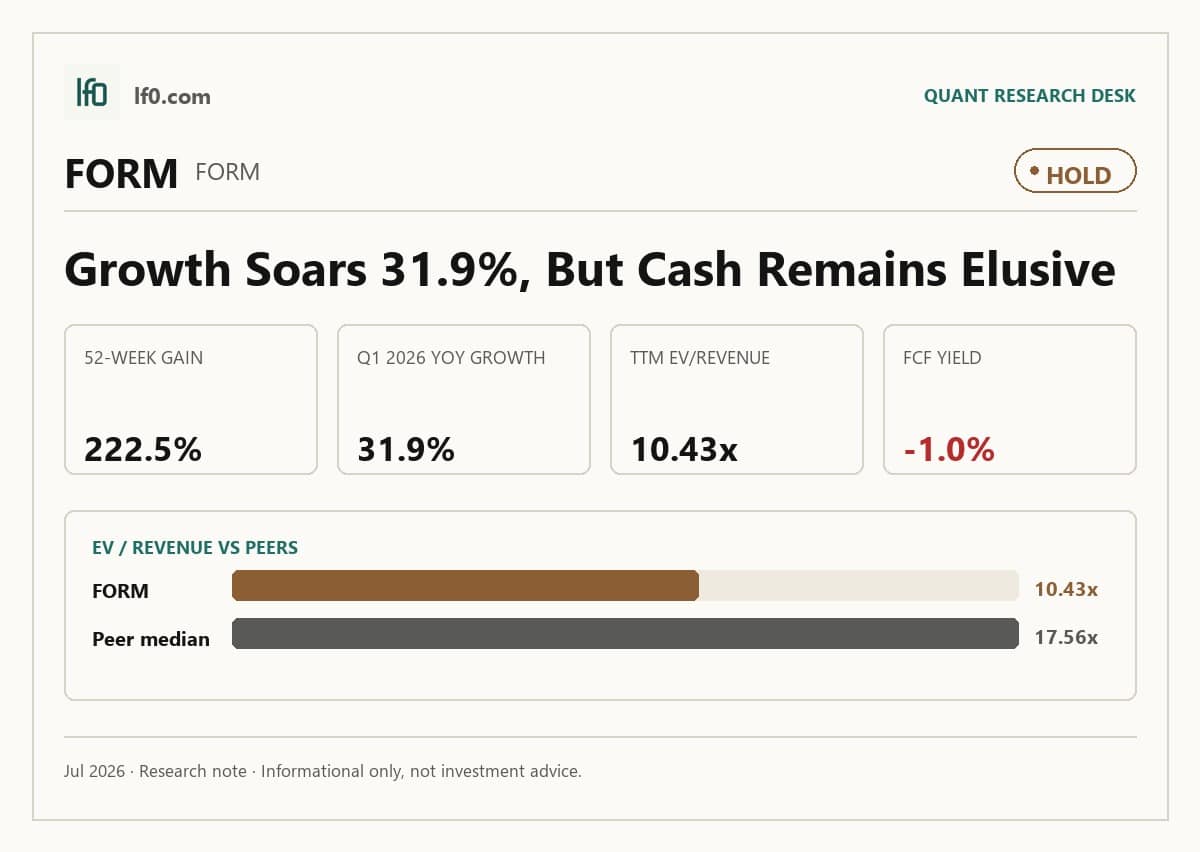
Quick Thesis
- Rated Hold — growth is real, but the stock already discounts much of it.
- Revenue reached $226.1M in Q1 2026, up 31.9% from Q1 2025.
- Main risk: customer concentration, with one customer at 22.9% of FY2025 revenue.
- Valuation is rich at 29.1x EV/EBITDA and 20.9x forward P/E.
- I would raise my rating if revenue stays above 25% growth and gross margin holds near 50.0%.
Executive Summary
Rating: HOLD | FORM
Measured from adjusted close on 2026-10-30 to 2026-11-10. Sell ratings are correct when the stock falls; Hold is tracked as a +/-10% range. Daily-close data, not intraday. Calls are tracked for 182 days from publication, then frozen as a final record.
I would put my rating as a Hold because FormFactor is executing well on AI and high bandwidth memory demand, but the shares already price in a lot of that improvement. Revenue rose from $171.4M in Q1 2025 to $226.1M in Q1 2026, and EBITDA increased from $12.1M to $32.9M over the same period, so the operating trend is clearly positive. Even so, the stock trades at 29.1x EV/EBITDA and 20.9x forward P/E, which leaves limited room for disappointment.
I would become more constructive if revenue growth stays above 25% year over year for another two quarters and gross margin holds near 50.0%, because that would show the mix is still improving without sacrificing product economics. If that happens, free cash flow should keep compounding and the market could justify a higher multiple.
Company Profile
FormFactor designs and sells electrical and optical test and measurement equipment used from semiconductor design through high-volume production. Revenue comes from probe cards, analytical probes, probe stations, thermal systems, cryogenic systems, and related services. The company was founded in 1993, shipped its first product in 1995, and now reports two segments: Probe Cards and Systems.
It serves semiconductor makers, foundries, fabless chip designers, universities, and scientific institutions across North America, Asia, Europe, and Japan. As of December 27, 2025, it operated primary manufacturing sites in Livermore and Beaverton, plus Boulder and several German locations, while a new Farmers Branch, Texas facility was being built for probe card production and is expected to begin ramping in late fiscal 2026. FormFactor is listed on Nasdaq under FORM and is financed primarily with equity and operating cash flow, with only a small disclosed debt balance.
Economic Moat
Business Model
The strongest part of FormFactor’s moat is its ability to build customer-specific probe cards with more than 150,000 contact elements and spacing as tight as 40 microns across a 300mm wafer, while still maintaining reliable contact through hundreds of thousands, and even millions, of compression cycles. In my view, that is hard to replicate quickly because it depends on proprietary design tools, MEMS-based manufacturing know-how, and long customer qualification cycles.
The moat is broader than probe cards alone. FormFactor also sells analytical probes, probe stations, thermal systems, and cryogenic systems, so it can serve customers from early research through high-volume production. That breadth makes it harder for a rival to displace the company across the full workflow, and it helps explain why the business has become more focused even as the product set has broadened.
Business & Operating Risks
The main disclosed risk is customer concentration tied to probe cards, which still generate the majority of revenue. One customer represented 22.9% of revenue, and two customers represented 33.5% of fiscal 2024 revenue, so a small number of accounts can move revenue and gross margin in the same quarter. The filing is explicit that losing a customer or even deferring a small number of purchases could materially reduce revenue, and that cancellation risk can also create non-recoverable costs and inventory write-downs.
A second risk is semiconductor cyclicality and limited backlog visibility. FormFactor does not have enough unfilled orders to cover quarterly revenue targets, so demand can shift quickly while the cost base stays fixed. The filing also flags slower-than-expected AI-related demand as a risk, which matters because the company is leaning on that end market to support the current growth rate.
The Farmers Branch ramp is a third risk, but I do not think it threatens the moat itself. It is more a timing and execution issue: if the site ramps late or with weak yields, the company could absorb higher costs before the new capacity contributes meaningfully to the managed-cost advantage the business is trying to build.
Management Discussion & Analysis
Management is responding to those risks, but not eliminating them yet. The company bought Keystone Photonics in December 2025 to strengthen its silicon photonics test position, and it also bought the Texas site that will support the probe card ramp in late fiscal 2026. At the same time, it adopted restructuring plans in January 2026 to consolidate Carlsbad and Baldwin Park manufacturing into other sites, which tells me management is actively trying to protect gross margin while it retools the footprint.
That said, the margin repair is still incomplete. Fiscal 2025 gross margin slipped to 39.3% from 40.3% in fiscal 2024, and management is still working through tariff pressure and restructuring charges. Cash and marketable securities totaled $275.2M at December 27, 2025, so the company has the balance-sheet capacity to fund the ramp, but the near-term earnings benefit is not yet visible.
Recent Events
The January 5, 2026 restructuring plan, disclosed in the January 9 8-K, is the most important recent event because it directly targets the cost base. Consolidating Carlsbad and Baldwin Park should improve manufacturing efficiency if execution is clean, but the plan also carries a roughly 30M to 40M charge, with about $10M to $15M in cash outlay. I read that as a deliberate trade-off: management is taking a near-term hit to strengthen the operating model.
On May 15, 2026, stockholders approved a 5.0 million share increase to the 2012 Equity Incentive Plan and approved officer exculpation under Delaware law. The equity authorization is a modest dilution risk, while the governance change is neutral to slightly positive for continuity. Taken together, the recent 8-Ks support the moat thesis because they show management is investing in capacity and efficiency rather than standing still.
Financial Analysis
Growth
FORM — Financial Growth (Quarterly, USD Mil)
| Metric | 2025-06-30 | 2025-09-30 | 2025-12-31 | 2026-03-31 | 2026-06-30 | 2026-09-30 |
|---|---|---|---|---|---|---|
| REVENUE (USD Mil) | 195.8 | 202.7 | 215.2 | 226.1 | — | — |
| EBIT (USD Mil) | 12.7 | 19 | 35 | 23.7 | — | — |
| EBITDA (USD Mil) | 22.2 | 28.7 | 44.4 | 32.9 | — | — |
| NET INCOME (USD Mil) | 9.1 | 15.7 | 23.2 | 20.4 | — | — |
| DILUTED EPS | — | 0.2 | 0.3 | 0.3 | 0.7 | 0.9 |
Source: Yahoo Finance — Quarterly Financial Statements
Revenue rose from $171.4M in Q1 2025 to $226.1M in Q1 2026, a 31.9% increase, and EBITDA climbed from $12.1M to $32.9M over the same span. That combination matters because it shows the business is not just growing, it is also gaining operating leverage as volume scales.
The company’s own disclosures tie that improvement to AI infrastructure and HBM demand, which is consistent with the moat described above: specialized test content is translating into higher throughput, not just more units. I would still watch whether the growth rate stays above 25% year over year, because that is the level that would tell me the current demand cycle is still expanding rather than normalizing.
Profitability
FORM — Profitability (TTM)
| Metric | TTM |
|---|---|
| Operating Margin (TTM) | 30.1% |
| Net Margin (TTM) | 17.7% |
| Return on Assets (TTM) | 10.1% |
| Return on Equity (TTM) | 15.8% |
| Gross Margin (TTM) | 50.2% |
| EBITDA Margin (TTM) | 25.4% |
Source: Yahoo Finance — Trailing Twelve Months (TTM)
Gross margin of 50.2% TTM remains the cleanest sign of product strength, while operating margin of 30.1% TTM shows that overhead is the main drag rather than manufacturing economics. EBITDA margin of 25.4% TTM confirms the company is already generating solid cash earnings before depreciation and amortization.
Net margin of 17.7% TTM and return on assets of 10.1% TTM show the model is profitable on a GAAP basis, and return on equity of 15.8% TTM is only modestly above ROA, which tells me leverage is not doing the heavy lifting. The key question is whether operating margin can keep narrowing the gap to gross margin; if it does, the moat will be showing up more clearly in earnings power.
Valuation
FORM — Valuation Multiples
| Metric | Value |
|---|---|
| Current Share Price (USD) | 88.6 |
| Market Cap (USD Mil) | 6,905 |
| Enterprise Value (USD Mil) | 7,262 |
| Trailing P/E | 40.6 |
| Forward P/E | 20.9 |
| Price/Sales (TTM) | 7 |
| Price/Book (mrq) | 5.9 |
| EV/Revenue | 7.4 |
| EV/EBITDA | 29.1 |
| Beta (5Y Monthly) | 1.18 |
| FCF Yield % (TTM) | 2.3% |
| Forward EPS (USD) | 4.2 |
| Analyst Target Price – Low (USD) | 110 |
| Analyst Target Price – Mean (USD) | 152.2 |
| Analyst Target Price – High (USD) | 200 |
| # Analyst Opinions | 9 |
Source: Yahoo Finance
FormFactor trades at 29.1x EV/EBITDA, 7.41x EV/Revenue, 7.05x Price/Sales, 40.6x trailing P/E, and 20.9x forward P/E, with a 2.31% FCF yield. At $88.6 per share, the market is paying for sustained AI-linked test demand and a higher mix of HBM-related orders rather than for this year’s earnings alone.
On my read, fair value sits in a range of roughly $39-$189 per share, using the peer EV/Revenue spread as a rough guide and then adjusting for FormFactor’s stronger cash generation and lighter leverage. That range sits inside the $110-$200 analyst target band, but below the $152.2 mean, which tells me the Street is still more optimistic than I am on how quickly the current growth can compound.
Forward EPS is 4.24, and that is the right lens for this name because the stock is being priced on earnings power that has not fully matured yet. Relative to peers, that EPS base is smaller than the large-cap equipment names, so the multiple is not cheap on a like-for-like basis even though the balance sheet is stronger than most of the group.
Leverage
FORM — Leverage & Coverage (Quarterly)
| Metric | Value |
|---|---|
| Total Debt/Equity % (mrq) | 2.4 |
| Current Ratio (mrq) | 3.7 |
| Total Debt (mrq, USD Mil) | 27.8 |
| Operating Cash Flow (TTM, USD Mil) | 257 |
| Levered Free Cash Flow (TTM, USD Mil) | 159.5 |
| Net Debt/EBITDA (TTM) | -1.5 |
| FCF Margin % (TTM) | 16.3% |
Source: Yahoo Finance — Quarterly Financial Statements
Total debt is 27.76M mrq, current ratio is 3.677x, and total debt/equity is 2.35% mrq, so the balance sheet is lightly levered. Operating cash flow was 257M TTM and levered free cash flow was 159.5M TTM, which means cash generation comfortably covers the company’s small debt load and ongoing investment needs.
Net debt/EBITDA was -1.5x TTM, so FormFactor is in a net cash position rather than a refinancing position. That matters because the Texas ramp can be funded without balance-sheet stress, and the company has room to absorb a softer demand quarter if the cycle turns.
Insider Activity
The insider tape is one-sided: 52 open-market sales and 0 open-market purchases over the period shown. The selling is broad enough to include the CEO and multiple directors, so I read it as a mild negative for alignment even though insider ownership is already low at 0.7%.
That said, I would not overstate the signal. With only 0.7% insider ownership, the incremental meaning of selling is smaller than it would be at a founder-led company, but the absence of any buying still leaves me cautious.
Comparable Analysis
LF0 has published standalone analyses of these peers: Teradyne (TER) (rated Hold); LRCX — Equity Research (LRCX) (rated Sell).
Growth
| Company | Revenue TTM (USD Mil) | Revenue Growth YoY % | EBITDA TTM (USD Mil) | Diluted EPS TTM |
|---|---|---|---|---|
| FORM | 980.1 | 38.4% | 249.5 | 2.2 |
| TER | 5,000.8 | 69.8% | 1,763.6 | 8.7 |
| AMAT | 30,837 | 24.8% | 10,155 | 11.6 |
| KLAC | 14,505.8 | 28.9% | 6,579.7 | 4 |
| LRCX | 26,127.9 | 54.4% | 10,116.4 | 6.7 |
| ACLS | 866.1 | 10.6% | 99.4 | 3 |
Source: Yahoo Finance
FormFactor’s revenue growth of 38.4% TTM is ahead of ACLS at 10.6%, but behind TER at 69.8%, LRCX at 54.4%, KLAC at 28.9%, and AMAT at 24.8%. That puts FORM in the upper half of the group on growth, which supports a premium to ACLS but not a premium to the fastest growers.
Valuation
| Company | Current Share Price (USD) | Trailing P/E | Forward P/E | EV/Revenue | EV/EBITDA | Price/Sales (TTM) | Price/Book (mrq) | Market Cap (USD Mil) | Enterprise Value (USD Mil) | Beta (5Y Monthly) | FCF Yield % (TTM) | Forward EPS | Analyst Target Price – Low | Analyst Target Price – Mean | Analyst Target Price – High | # Analyst Opinions |
|---|---|---|---|---|---|---|---|---|---|---|---|---|---|---|---|---|
| FORM | 88.6 | 40.6 | 20.9 | 7.4 | 29.1 | 7 | 5.9 | 6,905 | 7,262 | 1.18 | 2.3% | 4.2 | 110 | 152.2 | 200 | 9 |
| TER | 274.3 | 31.5 | 23.1 | 9.2 | 26.1 | 8.6 | 11.6 | 42,883 | 46,009 | 1.75 | 1.4% | 11.9 | 340 | 424.7 | 550 | 15 |
| AMAT | 396.1 | 34.2 | 21.3 | 10.8 | 32.8 | 10.2 | 12.3 | 314,324 | 332,741 | 1.59 | 1.0% | 18.6 | 358 | 627.8 | 900 | 36 |
| KLAC | 161.9 | 40.6 | 23.2 | 15.1 | 33.4 | 14.6 | 32.4 | 211,346 | 219,533 | 1.45 | 1.4% | 7 | 175 | 225.1 | 325 | 26 |
| LRCX | 241.2 | 35.9 | 19.8 | 12 | 31 | 11.6 | 21.7 | 301,844 | 314,075 | 1.85 | 1.5% | 12.2 | 255 | 364 | 500 | 30 |
| ACLS | 102.6 | 34.4 | 19.5 | 3.6 | 31.5 | 3.7 | 3 | 3,168 | 3,127 | 1.85 | 1.3% | 5.3 | 140 | 150 | 165 | 3 |
Source: Yahoo Finance
FORM trades at 29.1x EV/EBITDA versus TER at 26.1x, AMAT at 32.8x, KLAC at 33.4x, LRCX at 31.0x, and ACLS at 31.5x. On a cash-yield basis, FORM’s 2.3% FCF yield is the best in the set, which is why I think the stock is better supported than the headline multiple suggests, even though the market is already paying for the growth.
A $1 investment one year ago would be worth 2.04 in FORM, ahead of TER at 1.71, AMAT at 1.80, KLAC at 1.36, LRCX at 1.59, and ACLS at 1.35. I think that performance has run ahead of the fundamentals, because FORM’s multiple is already rich while its return profile is good but not clearly best in class.
Profitability
| Company | Operating Margin (TTM) | Net Margin (TTM) | Return on Assets (TTM) | Return on Equity (TTM) | Gross Margin (TTM) | EBITDA Margin (TTM) |
|---|---|---|---|---|---|---|
| FORM | 30.1% | 17.7% | 10.1% | 15.8% | 50.2% | 25.4% |
| TER | 30.9% | 27.5% | 21.6% | 42.7% | 59.3% | 35.3% |
| AMAT | 33.7% | 30.1% | 15.5% | 41.1% | 49.4% | 32.9% |
| KLAC | 45.0% | 36.2% | 22.3% | 91.4% | 61.5% | 45.4% |
| LRCX | 40.0% | 32.3% | 25.0% | 70.1% | 51.0% | 38.7% |
| ACLS | 9.4% | 10.7% | 4.1% | 8.9% | 43.0% | 11.5% |
Source: Yahoo Finance
FORM’s gross margin of 50.2% TTM is close to AMAT at 49.4% and above ACLS at 43.0%, but below TER at 59.3%, KLAC at 61.5%, and LRCX at 51.0%. The bigger gap is in EBITDA margin, where FORM’s 25.4% trails TER at 35.3%, AMAT at 32.9%, KLAC at 45.4%, and LRCX at 38.7%, which tells me the company still has room to improve operating efficiency even if product economics are already solid.
Leverage
| Company | Total Debt/Equity % (mrq) | Current Ratio (mrq) | Total Debt (mrq, USD Mil) | Operating Cash Flow TTM (USD Mil) | Free Cash Flow TTM (USD Mil) | Net Debt/EBITDA (TTM) | FCF Margin % (TTM) |
|---|---|---|---|---|---|---|---|
| FORM | 2.4 | 3.7 | 27.8 | 257 | 159.5 | -1.5 | 16.3% |
| TER | 3.7 | 2.1 | 137.1 | 1,329.5 | 602.7 | -0.2 | 12.0% |
| AMAT | 28.7 | 2.4 | 7,346 | 8,396 | 3,075.4 | -0.2 | 10.0% |
| KLAC | 87.7 | 2.8 | 5,723.3 | 4,512.4 | 2,870.8 | 0.1 | 19.8% |
| LRCX | 26.9 | 2.5 | 3,735.4 | 7,576.4 | 4,548.8 | -0.4 | 17.4% |
| ACLS | 6.5 | 4.9 | 69.8 | 75.3 | 42 | -3.3 | 4.9% |
Source: Yahoo Finance
FORM’s net debt/EBITDA of -1.5x is stronger than TER at -0.2x, AMAT at -0.2x, KLAC at 0.1x, and LRCX at -0.4x, while ACLS is even more cash-rich at -3.3x. The balance-sheet edge helps explain why FORM can sustain a higher multiple than some peers, but it does not fully justify the premium on its own.
Conclusion
I would put my rating as a Hold because the core tension is simple: FormFactor is growing quickly and generating cash, but the stock already reflects a lot of that strength. Revenue and EBITDA are both moving higher, the balance sheet is net cash, and the moat is real, yet the shares still trade at 29.1x EV/EBITDA and 20.9x forward P/E, so the market is already paying for a good outcome.
What would change my view is straightforward. I would move more toward a Buy if revenue growth stays above 25% year over year for two more quarters and gross margin stays near 50.0%, because that would show the AI and HBM mix is still expanding while the cost base is holding. I would move toward a Sell if growth falls below 15% year over year or gross margin slips under 47.0%, because that would tell me the premium multiple is resting on a fading order cycle rather than durable demand.
For now, I think the next phase is more likely to be digestion than a fresh rerating. The business is improving, but I want to see another couple of quarters prove that the growth rate and cash conversion can stay at this level before I would pay up again.
What to Watch Next
- Revenue growth above 25% year over year — would support a move toward Buy.
- Gross margin near 50.0% — would confirm the mix is still improving.
- Revenue growth below 15% year over year — would argue for a lower rating.
- Gross margin below 47.0% — would suggest the premium multiple is at risk.
- Texas ramp execution in late fiscal 2026 — would show whether new capacity is adding value.
Update Since Our Last Call
Rating unchanged: Hold (2026-07-16) → Hold (today). Stock return since our prior call: -9.0% (Hold range).
The prior call looks wrong so far: the stock return since entry is -9.0%, which leaves the Hold range intact but does not validate the original optimism. I would call that too early rather than proven right, because the shares have drifted lower instead of confirming the thesis.
What genuinely changed is that the new article puts more weight on operating improvement and valuation. It now cites Q1 2026 EBITDA of $32.9M versus $12.1M in Q1 2025, and it frames valuation at 29.1x EV/EBITDA and 20.9x forward P/E. It also emphasizes that gross margin is 50.2% TTM and that the Farmers Branch ramp is still a late fiscal 2026 execution issue, while the earlier piece leaned more on a margin reset and a heavier cash-conversion concern.
What stayed the same is the core setup: revenue growth is still strong, and customer concentration remains the main risk, with one customer at 22.9% of FY2025 revenue. The new analysis independently confirms that the moat is real and that the balance sheet is still a support, not the whole thesis.
On valuation, the prior article gave a fair-value range of “$64 to $175,” while the new article gives “roughly $39-$189 per share.” That range moved down on the low end and up on the high end, mainly because the new article leans more on stronger cash generation and lighter leverage, while still acknowledging the premium multiple and the concentration risk. The ratings are identical, so there is no disagreement there; where I weight the new article more heavily is on the improved EBITDA and gross-margin evidence, even though I still see the valuation as demanding.
What’s your take? I rated FormFactor (FORM) HOLD above — but the goal here is to get this right, not just to publish an opinion. What would you add to this analysis, or which risk or catalyst do you think I’m under- or over-weighting? Tell me in the comments.
Our track record: every directional call is tracked publicly on The Scorecard, and Stocks Covered lists every company we have rated and when.
Sources
- SEC 10-K Annual Report — filed 2026-02-20
- SEC 8-K Filing (2026-05-19)
- SEC 8-K Filing (2026-04-29)
- SEC 8-K Filing (2026-02-18)
- SEC 8-K Filing (2026-02-04)
- SEC 8-K Filing (2026-01-09)
- SEC Form 4 Insider Transaction (2026-06-04)
- SEC Form 4 Insider Transaction (2026-06-04)
- SEC Form 4 Insider Transaction (2026-05-22)
- SEC 10-K Annual Report — FY2026
- SEC 10-K Annual Report — FY2025
- SEC 10-K Annual Report — FY2024
- SEC 10-K Annual Report — FY2023
- SEC 10-K Annual Report — FY2022
Data sourced from Yahoo Finance and SEC EDGAR. Not investment advice.
Leave a Comment